Stock control when the machine counts every millilitre
Manual bar stocktakes measure the gap between what you bought and what is left. An automated bar measures what it actually poured - which changes what you can find out, and what you can fix.
- Business
- Inventory
- Bars
Traditional bar stocktaking works by subtraction: you know what you bought, you weigh what is left, and the difference is what went out. It is slow, it happens monthly at best, and it gives you one number per bottle with no explanation attached.
An automated bar inverts this. Every pour is recorded at the moment it happens, with a volume, a recipe and a timestamp. You are no longer inferring consumption, you are reading it.
That difference is worth more than it first appears.
What the gap between theory and reality tells you
With recorded pours you have two numbers for every bottle: what the machine says it dispensed, and what physically left the bottle. The gap between them is a diagnosis:
| Gap | Likely cause |
|---|---|
| Machine says less than the bottle lost | Leak, spillage, manual pours from the same bottle, or drift in calibration |
| Machine says more than the bottle lost | Calibration over-reporting, or a line that is not fully priming |
| Gap grows steadily over weeks | Tubing wear - the pump is slowly under-delivering against its stored flow rate |
| Gap appears suddenly | Something changed: a bottle swap, a tube, a new operator |
A traditional stocktake gives you a variance number. This gives you a variance number with a cause, which is the difference between knowing you have a problem and knowing what to do about it.
Pour cost stops being an estimate
Most venues compute pour cost from the recipe: this drink contains 40 ml of a bottle that cost 24 EUR for 700 ml, therefore the spirit cost is 1.37 EUR.
That calculation assumes the pour was 40 ml. When it is a human free-pouring, it was not - the overpour is typically 10 to 20%, and it is invisible because it never appears as a loss, only as stock disappearing faster than sales explain.
When the machine pours, the recipe figure and the real figure converge. Your margin per drink becomes a measured quantity rather than an aspiration, which means the menu decisions you make on top of it are based on something real.
Alerts beat counts
The genuinely useful output is not the report, it is the warning.
A system that knows the pour rate of every ingredient can tell you a bottle will run out during tonight’s service - before service, while you can still do something about it. That single capability is worth more than any monthly report, because it converts a stockout (lost sales, disappointed guests, a drink taken off the menu at peak) into a five-minute task during setup.
Set the thresholds by service pattern, not by percentage. “20% remaining” means something different for a fast-moving mixer than for a bitter you use 10 ml of. The useful threshold is time-based: will this last tonight?
What automation does not fix
Being clear about the boundary:
- The bottle that never reaches the machine. Recorded pours tell you what went through a pump. Stock that disappears between delivery and the line is invisible to it, and that remains a physical process problem.
- Manual pours from the same bottle. If staff also pour by hand from a bottle feeding a machine line, your two numbers diverge and neither is trustworthy. Decide which bottles are machine bottles and keep them separate.
- Deliveries recorded wrongly. The machine measures consumption, not receipt. A supplier short-delivering still needs a human checking the pallet.
- Waste and comps. A drink poured and then dropped counts as poured. If you want those separated, they need to be recorded as such.
Making it operational
The practical setup that works in a venue:
- Machine bottles are machine bottles. No hand pours from them. This single rule preserves the integrity of every number downstream.
- Weigh at open and close for the first two weeks. Compare to the machine’s figures until you trust them. After that, spot-check monthly.
- Set low-stock alerts before your first busy weekend, not after your first stockout.
- Review the variance report weekly, not monthly. A drift caught at one week is a tube change; caught at one month it is a season of wrong drinks.
- Export and keep the data. Year-on-year comparison of the same event or the same season is where the real planning value sits.
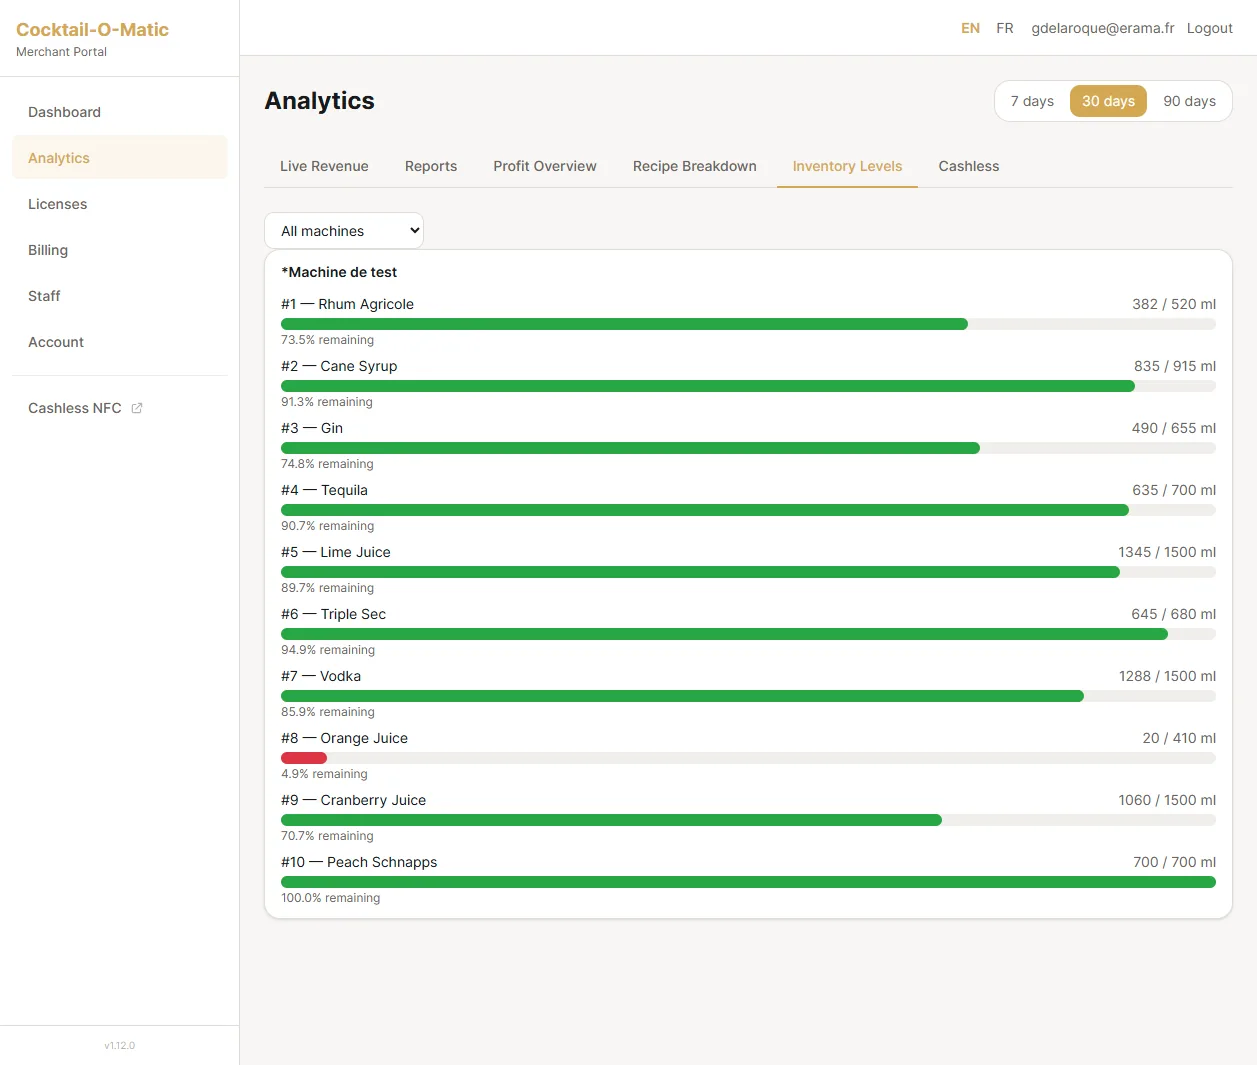
Cocktail-O-Matic tracks a filling level per pump, warns you on the dashboard when an ingredient drops below your low-stock threshold (20% by default, and configurable), and consolidates the picture across machines in the cloud portal. The CSV export covers transactions and revenue rather than stock itself, so if you want a stock history outside the portal you build it from the transaction log. The bars page covers how this fits an existing service, and you can look at the actual inventory screens in the live demo.
The change of habit
The hardest part of this is not technical. It is that stock control stops being a monthly ritual and becomes a weekly glance, and organisations are surprisingly attached to their rituals.
The venues that get value out of this are the ones where somebody looks at the variance every week and asks why. The data is the same either way; the difference is whether anyone reads it.